Ratul DebnathGeospatial · Planning
Environment / Academic research

Flood exposure in three dimensions

Combining LiDAR-derived buildings and mapped flood zones to make structural exposure visible.

Year
2024
Project type
Graduate course project
My role
LiDAR analysis & 3D cartography

Spring 2024 · GEOG 5373: Introduction to LiDAR & Radar · SHSU

Conroe, Texas
ArcGIS ProLiDAR3D GIS
Inside the analysis

From place to mapped exposure.

Explore the original study figures, from aerial context to a three-dimensional view of the results.

Place

Start with the place.

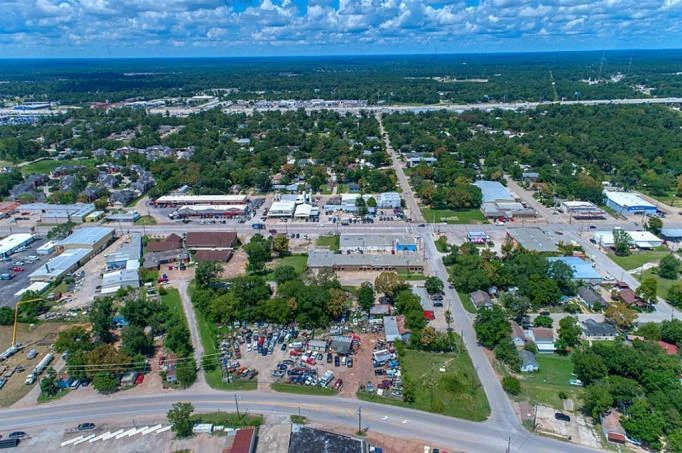
An aerial view gives the study a human scale: buildings, streets, and a connected urban landscape. The analysis asks how mapped flood exposure relates to that built environment.

Aerial photograph of Conroe reproduced in the original project poster.
Figure 6 · View full figure (opens in a new tab)
Flood zones

Read the flood-zone context.

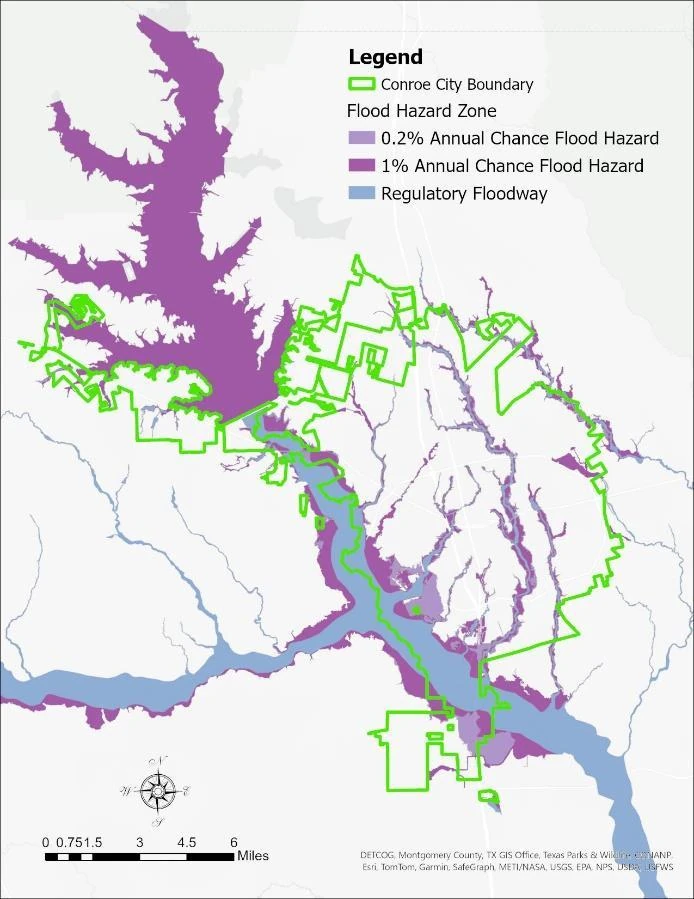
The mapped regulatory floodway and annual-chance flood zones provide the spatial context. Their boundaries are compared with the city and building information in the study.

Original Conroe map showing the city boundary, regulatory floodway, and 1% and 0.2% annual-chance flood hazard zones.
Figure 4 · View full figure (opens in a new tab)
Buildings

Connect the zones to buildings.

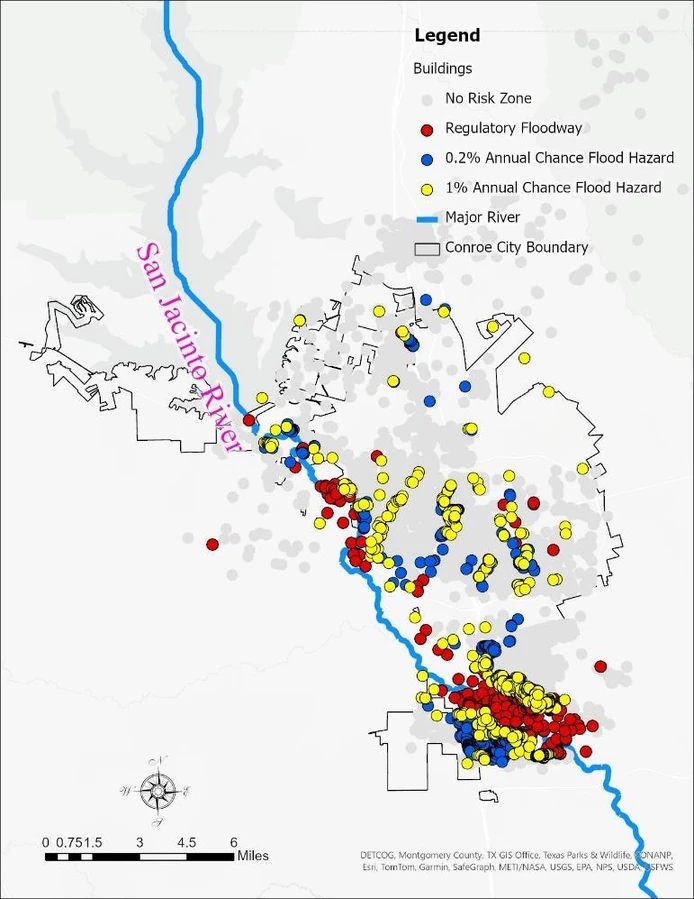
The building map translates broad zones into individual locations. Red, yellow, and blue markers identify the mapped exposure categories used in the poster; gray marks the remaining buildings.

Original Conroe building exposure map with red regulatory-floodway, yellow 1% annual-chance, blue 0.2% annual-chance, and gray building markers.
Figure 5 · View full figure (opens in a new tab)
3D perspective

Make the spatial relationship visible.

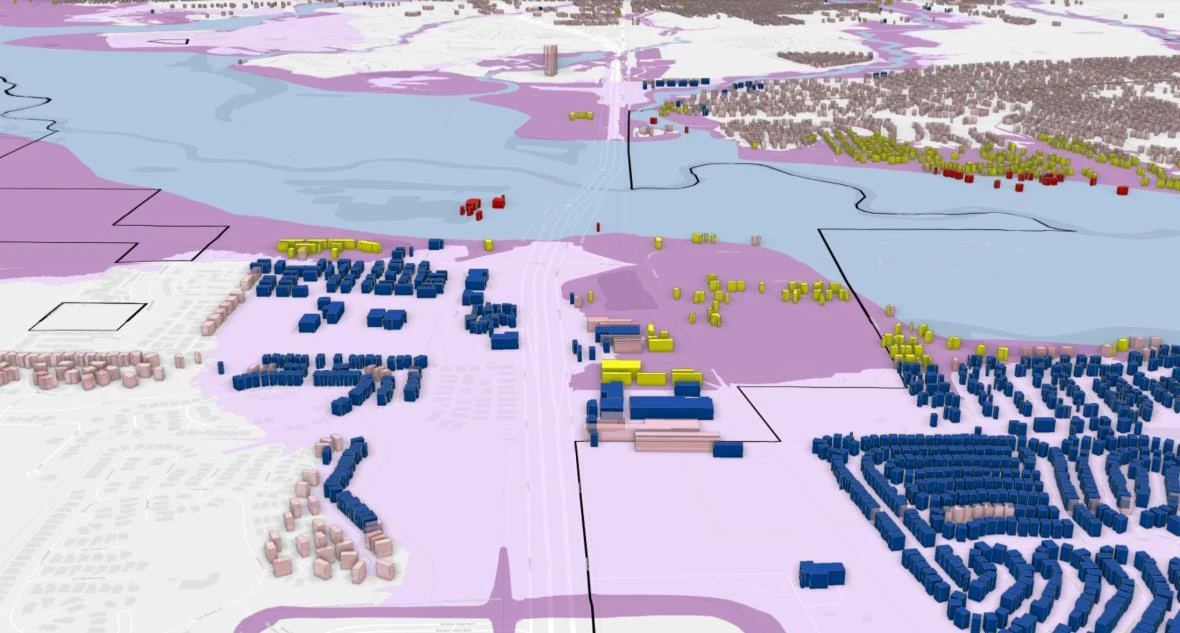
LiDAR-derived building models add height and spatial context to the mapped zones. This oblique study view helps communicate where structures sit relative to the mapped floodplain.

Original oblique 3D view of Conroe buildings and flood-zone overlays from the project poster.
Figure 2 · oblique view · View full figure (opens in a new tab)

Study figures: Ratul Debnath, Analyzing Flood Risks in Conroe City, Texas through LiDAR-Based 3D Building Models. The maps show the study’s mapped exposure categories, not a forecast of flood depth or timing.

Read the original poster
Two analytical views · One map extent

Reveal the relationship.

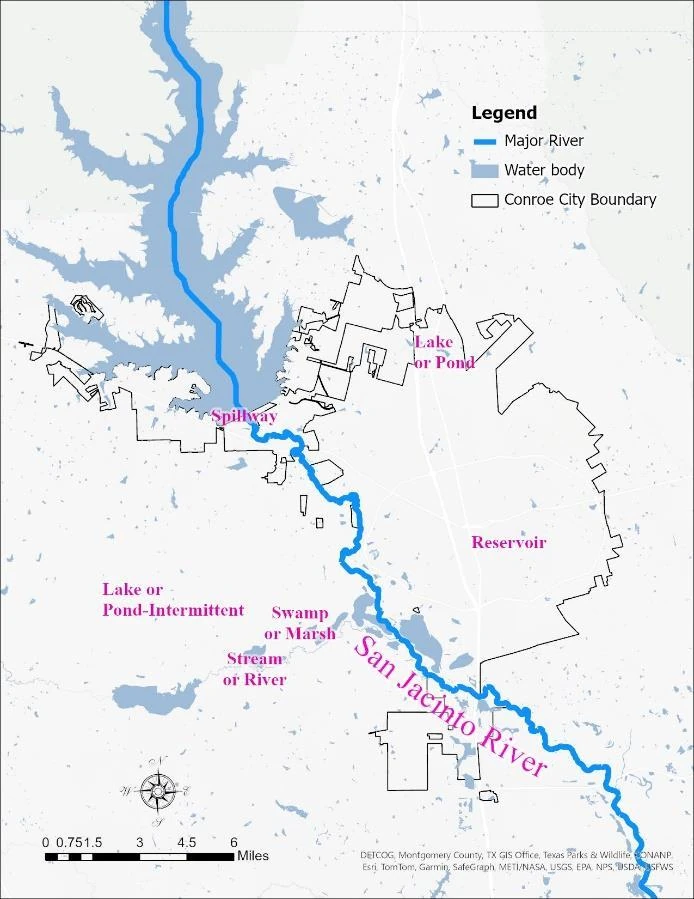
Compare the water context with the mapped building exposure. Move the divider to read the same place through two different views from the study.

Water context
River, water bodies, and city boundary · Figure 3

Mapped building exposure
Buildings classified against flood zones · Figure 5

These are complementary analytical views, not a before-and-after comparison.

Water-context map of Conroe showing the river, water bodies and city boundary.
Building-exposure map at the same extent, with buildings categorized by mapped flood-zone exposure.
The question

Which buildings intersect mapped flood zones, and how can 3D visualization make that exposure easier to understand?

The approach
  1. Processed LiDAR into a LAS dataset, classified building points, and created building footprints and multipatch models.
  2. Compared building locations with regulatory floodway, 1% annual-chance, and 0.2% annual-chance flood-hazard categories.
  3. Produced 2D maps and 3D scenes that connect building-level detail with neighborhood-scale patterns.
The outcome

The inventory recorded 514 buildings in the regulatory floodway, 1,284 in the 1% annual-chance category, and 1,740 in the 0.2% annual-chance category. Another 13,622 were outside the mapped zones.

Original project document

Analyzing Flood Risks in Conroe City, Texas through LiDAR-Based 3D Building Models
Research poster · PDF · 1 page · 842 KB

Original project poster showing 3D buildings and flood-zone maps for Conroe
Original project poster showing 3D buildings and flood-zone maps for Conroe. Select the image to view it at full size.

Message Ratul

Personal & professional connections

Have an opportunity or an idea to share? Leave a message here. This is an email conversation, with replies sent to your inbox.

Required fields are marked *. Replies arrive by email.

How your message is delivered

Your details are sent to Ratul’s inbox through FormSubmit (privacy policy). FormSubmit retains submissions for 30 days. This website does not save your message in your browser.

Prefer email? ratuldebnathgis@gmail.com